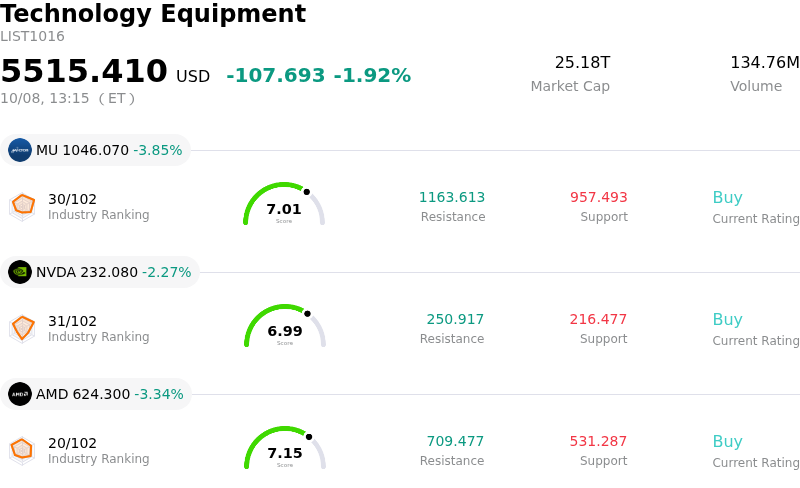
Advanced Micro Devices Inc (AMD) moved down by 3.38%. The Technology Equipment sector is down by 1.92%. The company underperformed the industry. Top 3 stocks by turnover in the sector: Micron Technology Inc (MU) down 3.91%; NVIDIA Corp (NVDA) down 2.20%; Advanced Micro Devices Inc (AMD) down 3.38%.
What is driving Advanced Micro Devices Inc (AMD)’s stock price down today?
AMD experienced a noticeable pullback and heightened intraday volatility as market participants engaged in profit-taking following a powerful multi-week rally that pushed the company into historical high territory and a trillion-dollar market valuation. Technical momentum indicators had reached overbought territory, prompting short-term traders and institutional funds to lock in gains near key resistance levels. This technical consolidation comes despite strong underlying momentum in the semiconductor sector, where robust demand for artificial intelligence hardware has driven valuation multiples to elevated levels relative to historical averages.
The price action coincided with AMD formalizing its third-quarter earnings schedule and detailing management's participation in major upcoming institutional technology conferences. While investor expectations remain high for the company's Data Center segment, driven by scaling sales of EPYC server CPUs and Instinct accelerators, supply chain constraints remain a central focal point. Recent commentary from corporate leadership regarding aggressive long-term wafer capacity and high-bandwidth memory planning with key foundry and memory partners highlights that near-term upside is constrained by production ceilings, leading some market participants to digest how quickly explosive projected growth can materialize.
Additionally, headlines surrounding AMD's involvement in a federal artificial intelligence research initiative—requiring substantial commitments of computing credits—reinforced the company's strategic positioning while drawing attention to capital allocation requirements. Wall Street analysts maintain a generally bullish stance, supported by recent price target upgrades citing expanding addressable markets for agentic AI computing. However, with high forward earnings multiples, active institutional portfolio rebalancing, and major semiconductor supply chain earnings reports on the immediate horizon, trading activity reflects a temporary recalibration between long-term fundamental expansion and short-term valuation premium.
Technical Analysis of Advanced Micro Devices Inc (AMD)
Technically, Advanced Micro Devices Inc (AMD) shows a MACD (12,26,9) value of 1.339, indicating a buy signal. The RSI at 62.583 suggests neutral condition and the Williams %R at 44.485 suggests buy condition. Please monitor closely.
Media Coverage of Advanced Micro Devices Inc (AMD)
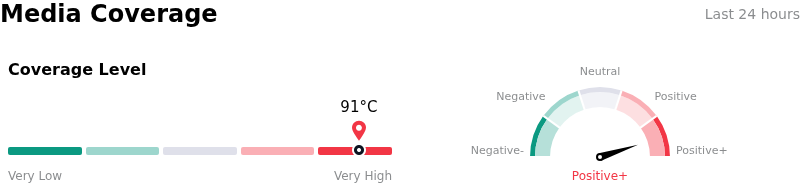
In terms of media coverage, Advanced Micro Devices Inc (AMD) shows a coverage score of 91, indicating a very high level of media attention. The overall market sentiment index is currently in extremely bullish zone.
Fundamental Analysis of Advanced Micro Devices Inc (AMD)
Advanced Micro Devices Inc (AMD) is in the Technology Equipment industry. Its latest annual revenue is $34.64B, ranking 9 in the industry. The net profit is $4.33B, ranking 12 in the industry. Company Profile
Over the past month, multiple analysts have rated the company as Buy, with an average price target of $620.89, a high of $1250.00, and a low of $320.00.
More details about Advanced Micro Devices Inc (AMD)
Company Specific Risks:
- Elevated Valuation and Stretched Multiples: AMD's trailing price-to-earnings ratio exceeding 160x leaves the stock vulnerable to sharp pullbacks, as recent options market positioning showed a rising put/call ratio of 1.07 reflecting investor caution near high historical valuations.
- Heavy Insider Stock Liquidation: Recent SEC filings reveal that insiders have sold over $105 million worth of company stock over the past three months, including sales from key executive leadership, signaling profit-taking at current levels.
- Overbought Technical Indicators and Volume Fatigue: Technical momentum has stalled as the stock hit resistance near $658. An overbought RSI above 70 combined with a ~30% decline in daily trading volume relative to averages has triggered intraday selling pressure.
- High Execution Pressure Ahead of Q3 Earnings: Following the announcement of its upcoming Q3 earnings date, the market faces heightened expectations for over 60% EPS growth, creating downside risk if data center GPU/CPU platform deliveries suffer delays or if non-AI segments face margin contraction.
Find out more