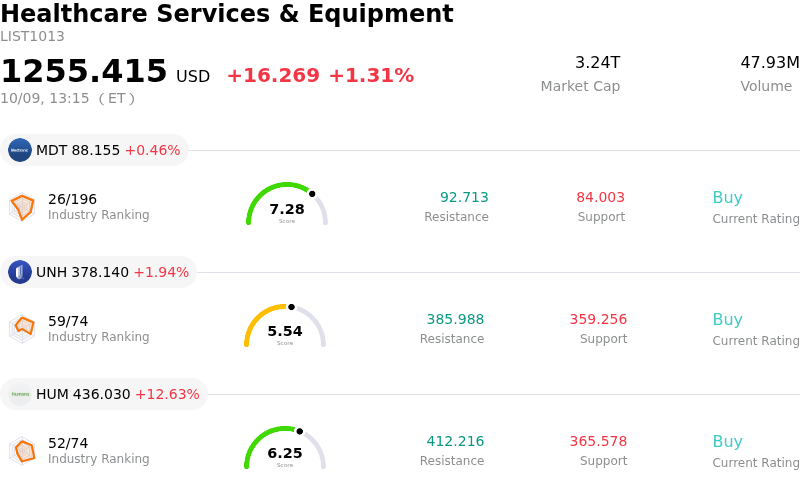
Humana Inc (HUM) moved up by 12.68%. The Healthcare Services & Equipment sector is up by 1.31%. The company outperformed the industry. Top 3 stocks by turnover in the sector: Medtronic PLC (MDT) up 0.46%; Unitedhealth Group Inc (UNH) up 1.94%; Humana Inc (HUM) up 12.63%.
What is driving Humana Inc (HUM)’s stock price up today?
The substantial upward momentum in Humana’s stock is primarily driven by a major favorable regulatory update from the Centers for Medicare & Medicaid Services regarding its Medicare Advantage Star Ratings. Humana announced a dramatic operational turnaround in its plan quality scores, revealing that an overwhelming majority of its Medicare Advantage enrollees will be covered by plans receiving four stars or higher. This marks a sharp recovery from the previous year's lower rating distribution, which had severely restricted the company’s access to federal quality bonus payments.
The restoration of high star ratings across Humana's key operating contracts—most notably its primary Medicare Advantage contract covering millions of members—significantly alters the company’s financial trajectory. Achieving the four-star threshold unlocks substantial quality bonus payments from the federal government, directly supporting margin expansion and profitability recovery. In conjunction with the regulatory announcement, management reaffirmed its full-year adjusted earnings outlook and expressed confidence in its long-term earnings potential, easing investor concerns over prior cost and rating headwinds.
The unexpected strength of the quality ratings prompted a wave of positive Wall Street actions, with several major brokerage firms raising price targets and upgrading their investment ratings on the stock. Analysts highlighted that Humana emerged as the premier beneficiary among health insurers, significantly outperforming key managed care peers whose star plan distributions faced reductions. This operational divergence positioned Humana as a clear standout within the managed care sector, sparking aggressive institutional buying as market participants priced in enhanced revenue collection and an improved competitive footing.
Technical Analysis of Humana Inc (HUM)
Technically, Humana Inc (HUM) shows a MACD (12,26,9) value of 6.832, indicating a buy signal. The RSI at 67.254 suggests neutral condition and the Williams %R at 23.368 suggests buy condition. Please monitor closely.
Fundamental Analysis of Humana Inc (HUM)
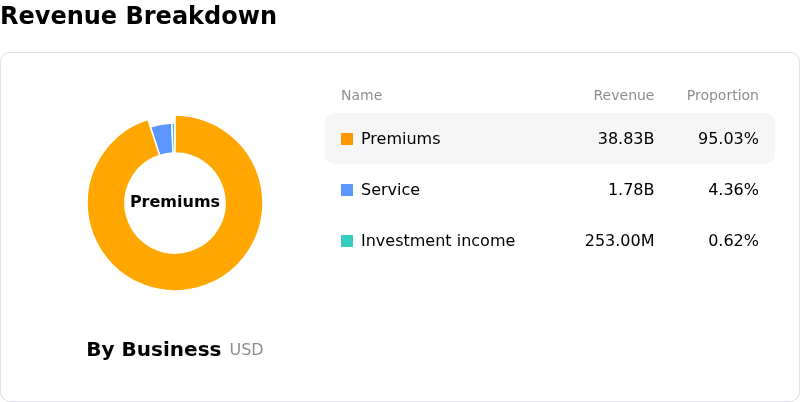
Humana Inc (HUM) is in the Healthcare Services & Equipment industry. Its latest annual revenue is $129.66B, ranking 6 in the industry. The net profit is $1.19B, ranking 8 in the industry. Company Profile
Over the past month, multiple analysts have rated the company as Buy, with an average price target of $427.04, a high of $515.00, and a low of $280.00.
More details about Humana Inc (HUM)
Company Specific Risks:
- Delayed Timing of Medicare Quality Bonus Revenues: Although 2027 Medicare Advantage Star Ratings improved significantly, the associated federal quality bonus payments will not accrue until 2028, leaving near-term earnings vulnerable to tight operating margins and compressed profitability across 2026 and 2027.
- Membership Contraction and Geographic Retrenchment: Humana is reducing its coverage footprint from 85% to roughly 80% of U.S. counties and shedding an estimated 600,000 lower-return Medicare Advantage members, which creates top-line execution risks if high-value member retention targets fail to materialize.
- GAAP EPS Reconciliation Uncertainty and Restructuring Charges: In an SEC Form 8-K filing on October 9, 2026, the company acknowledged an inability to reconcile its full-year 2026 adjusted EPS guidance with GAAP diluted EPS due to ongoing value-creation investments, potential GAAP earnings adjustments, and tight regulatory compliance costs.
- Elevated Technical Overbought Signals and Intra-Day Volatility: Following a sudden intraday surge of over 15% toward new 52-week highs, momentum indicators show overbought conditions and profit-taking pressure, exposing the stock to sharp pullbacks if upcoming quarterly financial closures or the December investor update fall short of elevated expectations.
Find out more